Superintendent's Proposed Attendance Area Adjustment Plan Overview
Transcript
← Additional information about the redistricting process for the 2023-2024 school year.
Superintendent’s Recommendation
Greetings, I am Matt Sachs with Cooperative Strategies, and this is a brief overview of the Superintendent’s Recommended Attendance Area Adjustment Plan. This video only addresses the recommendation itself. For more information about the process, please watch the September 1st, 2022, board meeting video or review the PDF of the full presentation which are both available on BoardDocs.
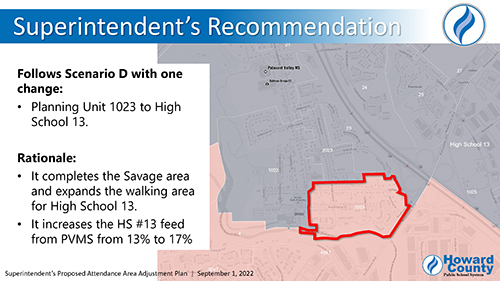
The Superintendent’s Recommendation mirrors Scenario D from the Feasibility Study that was presented at the June 9, 2022 board meeting with one change: planning unit 1023 would be reassigned from Hammond High School to High School #13. There are several reasons for this change.
First, reassigning planning unit 1023 to High School #13 keeps the neighborhood in the Savage area near the Savage Library together.
Second, it increases the feeder percentage at High School #13 from Patuxent Valley Middle School from 13 percent to 17 percent, which avoids the creation of a new low percentage feed.
Finally, there may be portions of this planning unit that would be within walking distance of High School #13.
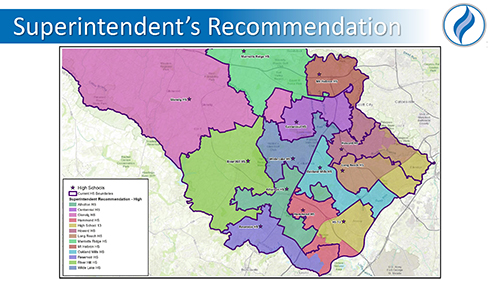
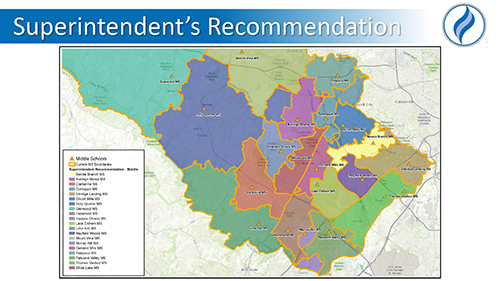
This map compares the recommended high school attendance areas in the shaded colors to the current attendance areas in the purple outlines.
The attendance areas for High School #13 are shown in gold, Reservoir High School in lavender, Hammond High School in red, Long Reach High School in light brown, Howard High School in maroon, and Mount Hebron High School in dark brown.
Per Scenario D from the Feasibility Study, Atholton High School, shown in green, and Oakland Mills High School, shown in light blue, are unchanged.
Again, the only change from Scenario D in the Feasibility Study is that students who live in planning unit 1023 would attend High School #13 instead of Hammond High School where they are currently assigned.
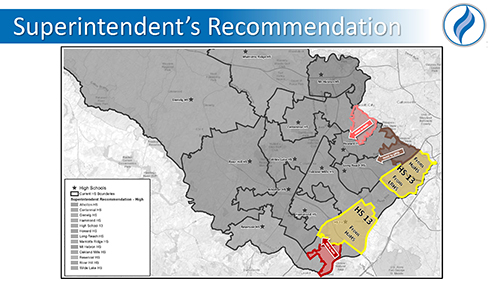
This map illustrates the areas reassigned in the recommendation.
There are two tiers of change.
The areas outlined in yellow which are currently assigned to Hammond High School, Long Reach High School, and Howard High School would be reassigned to High School #13.
Then, to back fill those schools, the area outlined in red would be reassigned from Reservoir High School to Hammond High School, the area outlined in pink would be reassigned from Mount Hebron High School to Howard High School, and the small area outlined in brown would be reassigned from Howard High School to Long Reach High School, to avoid creating a low percentage feed.
This map compares the recommended middle school attendance areas in the shaded colors to the current attendance areas outlined in orange. As you will see on the next slide, this involves minimal change and still mirrors Scenario D in the Feasibility Study.
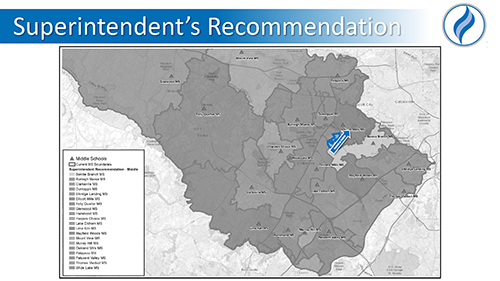
There is one area outlined in blue that would be reassigned from Oakland Mills Middle School to Ellicott Mills Middle School, which would eliminate an existing low percentage feed at Howard High School from Oakland Mills Middle School.
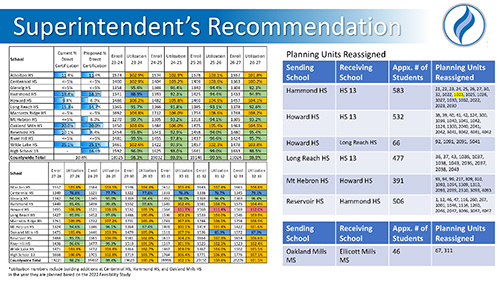
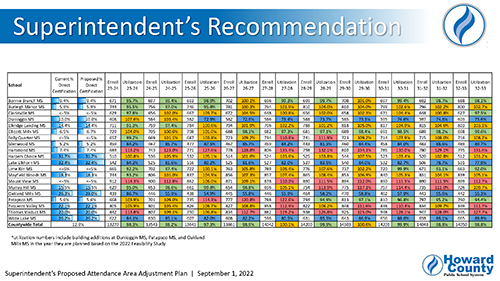
This slide shows the direct certification and capacity utilization data associated with the recommendation as well as the areas reassigned, number of students impacted, and planning unit numbers. As a reminder, direct certification is the socio-economic indicator that we are using in this process and its purpose is to measure relative change to current levels. The recommendation would reassign approximately 2,555 projected high school students, of which more than 60% would be assigned to High School #13. This recommendation impacts the least number of students compared to the other three scenarios in the Feasibility Study.
As you can see, this recommendation balances utilization among the high schools impacted, with all high schools projected to stay under 110 percent until the 2030-31 school year. These figures reflect immediate implementation, meaning that all projected 9th through 12th grade students living in the impacted geographies are included in the calculation. The next slide will show the utilization reflective of a two-year phased implementation.
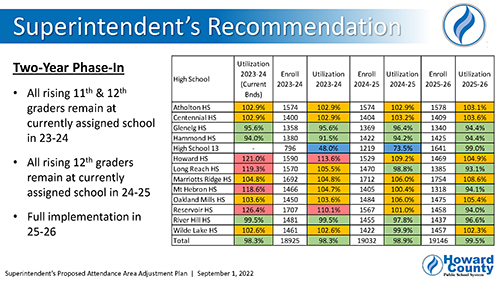
This slide shows the high school utilization assuming a two-year phased approach for all changes. High School #13 is shown as opening with only 9th and 10th graders for the 2023-2024 school year and eventually growing to have 9th through 12th graders beginning in school year 2025-2026.
This means that all rising 11th and 12th graders would remain at their currently assigned school for the 2023-2024 school year, and then for the 2024-2025 school year, rising 12th graders would stay and finish at their currently assigned school.
The key takeaway from this slide is that a two-year phased approach does not cause any single school to increase in utilization above currently projected levels.
This slide shows the utilization at the middle school level. Again, the recommendation only involves changes from Oakland Mills Middle School to Ellicott Mills Middle School.
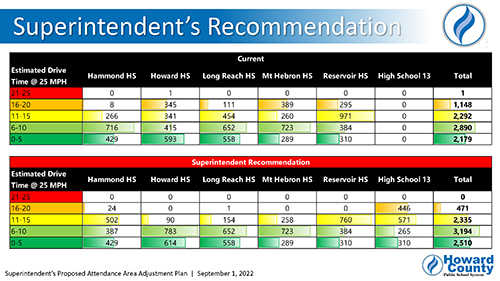
This slide shows the change in travel time between the current boundaries and the recommendation. This is modeled based on the average drive time from the center points of each planning unit to the assigned schools using the roads, and not exceeding 25 miles per hour. This is not reflective of bus times.
In this recommendation, an additional 331 students would have travel times less than five minutes. This is mostly associated with the opening of High School #13 since it will be much closer for students in the Jessup area than their currently assigned school.
The number of students with travel times of 16 to 20 minutes is reduced by 677 students which is a 59% reduction from the current number.
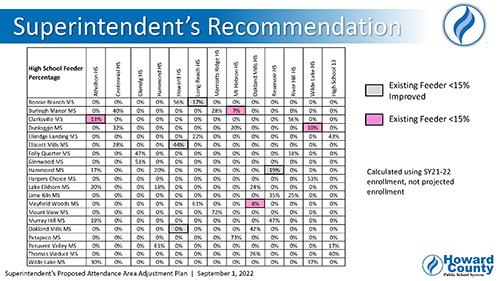
Finally, this table shows the resulting feed percentages at each high school from each middle school. The policy definition of a low percentage feed is less than 15%.
Numbers with a thick outline represent an existing low percentage feed.
Of those numbers, those that are highlighted in gray indicate that the feed percentage would be greater than 15% which is an improvement.
Numbers that are highlighted in pink represent an existing feed that would remain the same.
Overall, this recommendation would remedy four of the eight existing low percentage feeds, and not create any new ones.
Testimony
The Board of Education is currently accepting public testimony and I encourage you to share either written or verbal testimony with the Board. Information about how to provide your testimony along with additional information about the redistricting process can be found on the HCPSS website by visiting https://www.hcpss.org/redistricting. The Board has scheduled public hearing(s) and work session(s) and will make its final decision on boundary changes for the 2023-2024 school year no later than November 17, 2022.
Thank You
Thank you for taking the time to review this presentation.