What Your Child Will Learn in High School Algebra I
Algebra I
Standards for Mathematical Practice
The Standards for Mathematical Practice describe varieties of expertise that mathematics educators at all levels should seek to develop in their students.
- Make sense of problems and persevere in solving them.
- Reason abstractly and quantitatively.
- Construct viable arguments and critique the reasoning of others.
- Model with mathematics.
- Use appropriate tools strategically.
- Communicate mathematical problems and solutions clearly and accurately, using appropriate symbols, definitions, and degrees of precision.
- Look for and make use of structure.
- Look for and express regularity in repeated reasoning.
The Mathematical Content Standards
The Mathematical Content Standards (Essential Curriculum) that follow are designed to promote a balanced combination of procedure and understanding. Expectations that begin with the word “understand’’ are often especially good opportunities to connect the mathematical practices to the content. The content standards that set an expectation of understanding are potential points of intersection between the Mathematical Content Standards and the Mathematical Practices.
Unit 1: Relationships between Quantities and Reasoning with Equations
Reason quantitatively and use units to solve problems.
- Choose and interpret units consistently in formulas: choose and interpret the scale and the origin in graphs and data displays.
- Define appropriate quantities for the purpose of descriptive modeling.
- Choose a level of accuracy appropriate to limitations on measurement when reporting quantities.
Interpret the structure of expressions.
- Interpret parts of an expression, such as terms, factors, and coefficients.
- Interpret complicated expressions by viewing one or more of their parts as a single entity.
Work with radicals and integer exponents.
- Know and apply the properties of integer exponents to generate equivalent expressions.
- Use square root and cube root symbols to represent solutions to simple quadratic and cubic equations. Evaluate square roots of small perfect squares and cube roots of small perfect cubes.
Extend the properties of exponents to rational exponents.
- Explain how the definition of the meaning of rational exponents follows from extending the properties of integer exponents to those values.
- Rewrite expressions involving radicals and rational exponents using the properties of exponents.
Create equations that describe numbers or relationships.
- Create equations and inequalities in one variable and use them to solve problems.
Understand solving equations as a process of reasoning and explain the reasoning.
- Explain each step in solving a linear equation. Construct a viable argument to justify a solution method.
Solve equations and inequalities in one variable.
- Solve linear equations and inequalities in one variable, including equations with coefficients represented by letters.
Create equations that describe numbers or relationships.
- Rearrange linear formulas to highlight a quantity of interest.
Understand the concept of a function and use function notation.
- Understanding that a function assigns to each element of the domain exactly one element of the range.
- Use function notation, evaluate functions for inputs in their domains, and interpret statements that use function notation in terms of a context.
Create equations that describe numbers or relationships.
- Create linear equations to represent relationships between quantities.
- Graph equations on coordinate axes with labels and scales.
Represent and solve equations and inequalities graphically.
- Understand that the graph of an equation in two variables is the set of all its solutions plotted in the coordinate plane.
Create equations that describe numbers or relationships.
- Represent constraints by linear equations or inequalities, and by systems of linear equations and/or inequalities.
- Interpret solutions as viable or non-viable options in a modeling context.
Unit 2: Linear and Exponential Relationships
Understand the concept of a function and use function notation.
- Recognize that sequences are functions, sometimes defined recursively, whose domain is a subset of the integers.
Build a function that models a relationship between two quantities.
- Determine an explicit expression, a recursive process, or steps for calculation from a context.
- Combine standard function types using arithmetic operations.
- Write arithmetic and geometric sequences both recursively and with an explicit formula, use them to model situations, and translate between the two forms.
Construct and compare linear and exponential models and solve problems.
- Distinguish between situations that can be modeled with linear functions and with exponential functions.
- Prove that linear functions grow by equal differences over equal intervals; and that exponential functions grow by equal factors over equal intervals.
- Recognize situations in which one quantity changes at a constant rate per unit interval relative to another.
- Recognize situations in which a quantity grows or decays by a constant percent rate per unit interval relative to another.
- Construct linear and exponential functions given a graph, a description of a relationship, or a table.
Interpret linear and exponential functions that arise in applications in terms of a context.
- Interpret key features of a function graph and table in terms of the quantities, and sketch the graph.
- Relate the domain of a function to its graph and, where applicable, to the quantitative relationship it describes.
- Calculate and interpret the average rate of change of a function a specified interval. Estimate the rate of change from a graph.
Analyze linear and exponential functions using different representations.
- Graph linear and exponential functions expressed symbolically and show key features of the graph.
- Compare properties of two functions each represented in different ways.
Build new functions from existing functions.
- Identify the effect of the graph of replacing f(x) by f(x) + k, k f(x), f(kx), and f(x + k) for specific values of k (both positive and negative).
- Find the values of k given the graphs.
Interpret expressions for functions in terms of the situations they model.
- Interpret the parameters in a linear or exponential function in terms of a context.
Summarize, represent, and interpret data on quantitative variables.
- Represent data on two quantitative variables on a scatter plot, and describe how the variables are related.
- Fit a function to the data; use functions fitted to data to solve problems in the context of the data.
- Informally assess the fit of a linear function by plotting and analyzing residuals.
- Fit a linear function for a scatter plot that suggests a linear association.
Interpret linear models.
- Interpret the slope and the intercept of a linear model in the context of the data.
- Compute and interpret the correlation coefficient of a linear fit.
- Distinguish between correlation and causation.
Solve systems of equations.
- Analyze and solve pairs of simultaneous linear equations.
- Understand that solutions to a system of two linear equations in two variables correspond to points of intersection of their graphs.
- Solve systems of two linear equations in two variables algebraically, and estimate solutions by graphing the equations.
- Solve real-world and mathematical problems leading to two linear equations in two variables.
- Solve systems of linear equations exactly and approximately.
Represent and solve equations and inequalities graphically.
- Explain why the x coordinates of the points where the graphs of the equations y = f(x) and y = g(x) intersect are the solutions of the equation f(x) = g(x); find the solutions approximately.
- Graph the solutions to a linear inequality in two variables as a half-plane.
- Graph the solution set to a system of linear inequalities in two variables as the intersection of the corresponding half-planes.
Unit 3: Descriptive Statistics
Summarize, represent, and interpret data on a single count or measurement variable.
- Represent data with plots on the real number line (dot plots, histograms, and box plots).
- Use statistics appropriate to the shape of the data distribution to compare center and spread of two or more different sets.
- Interpret differences in shape, center, and spread in the context of the data sets, accounting for possible effects of extreme data points.
Summarize, represent, and interpret data on two categorical and quantitative variables.
- Summarize categorical data for two categories in two-way frequency tables.
- Interpret relative frequencies in the context of the data.
Unit 4: Quadratic Functions and Modeling
Perform arithmetic operations on polynomials.
- Understand that polynomials are closed under the operations of addition, subtraction and multiplication.
- Add, subtract and multiply polynomials.
Build a function that models a relationship between two quantities.
- Write a quadratic function that describes a relationship between two quantities.
Analyze functions using different representations.
- Graph linear and quadratic functions and show intercepts, maxima and minima.
Interpret functions that arise in applications in terms of a context.
- For a quadratic function that models a relationship between two quantities, interpret key features of graphs and tables in terms of the quantities, and sketch graphs showing key features given a verbal description of the relationship.
- Relate the domain of a function to its graph and, where applicable, to the quantitative relationships it describes.
Interpret the structure of expressions.
- Interpret quadratic expressions that represent a quantity in terms of its context.
- Interpret parts of an expression, such as terms, factors, and coefficients.
- Interpret complicated expressions by viewing one or more of their parts as a single entity.
- Use the structure of an expression to identify ways to rewrite it.
Write expressions in equivalent forms to solve problems.
- Choose and produce an equivalent form of an expression to reveal and explain properties of the quantity represented by the expression.
- Factor a quadratic expression to reveal the zeros of the function it defines.
- Complete the square in a quadratic expression to reveal the maximum or minimum value of the function it defines.
Solve equations and inequalities in one variable.
- Solve quadratic equations in one variable.
- Use the method of completing the square to transform any quadratic equation in x into an equation of the form (x – p)2 = q that has the same solutions. Derive the quadratic formula from this form.
- Solve quadratic equations by inspection, taking square roots, completing the square, the quadratic formula and factoring.
Analyze functions using different representations.
- Use the process of factoring and completing the square in a quadratic function to show zeros, extreme values, and symmetry of the graph, and interpret these in terms of a context.
For more information about the Algebra I curriculum and resources to support your child at home, visit http://hcpssfamilymath.weebly.com/
Sample Test Questions
In the spring, students will take the PARCC Assessment for Algebra I. On the exam, students will be asked to solve problems involving the key knowledge and skills for their grade level, express mathematical reasoning and construct a mathematical argument, and apply concepts to solve and model real-world problems. Items on the test will assess the following components of rigor:
- Conceptual understanding
- Procedural fluency
- Application
Types of Tasks
- Type I: Tasks assessing concepts, skills and procedures.
- Type II: Tasks assessing expressing mathematical reasoning.
- Type III: Tasks assessing modeling and applications.
Type I Tasks
Sample #1
Solve the following equation:
(3x – 2)2 = 6x – 4
When you are finished, enter the solution(s) below.
Sample #2
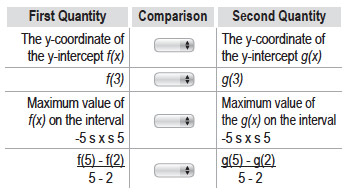
A portion of the graph of a quadratic function f(x) is shown in the xy-plane. Selected values of a linear function g(x) are shown in the table.
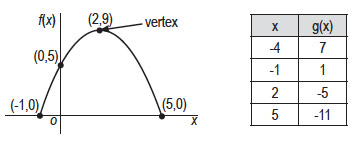
For each comparison below, use the drop-down menu to select a symbol that correctly indicates the relationship between the first and the second quantity.
Type II Tasks
Sample
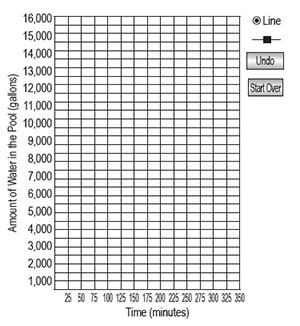
Myla’s swimming pool contains 16,000 gallons of water when it is full. On Thursday, her pool was only partially full. On Friday, Myla decided to fill her pool completely using a hose that flowed at a rate of 10 gallons per minute. It took her 5 hours to completely fill her pool.
Part A
Type a number into each box to complete the sentences.
Before Myla started filling the pool, there were (blank) gallons of water in the pool.
The rate at which water is being added to the pool is (blank) gallons per hour.
Part B
On the coordinate plane provided, graph a linear function that represents the number of gallons of water in Myla’s pool given the amount of time, in minutes, she spent filling her pool on Friday.
Select two points on the coordinate plane and the line containing two points will be automatically drawn. You can undo your last step by clicking “Undo.” You can reset the tool by clicking “Start Over.”
Type III Tasks
Sample
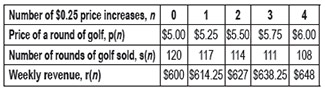
A local mini golf course charges $5 per person to play a round of golf, and the course sells 120 rounds of golf per week. The manager of the course studied the effect of raising the price to increase revenue and found the following data.
The table shows the price, number of rounds of golf, and weekly revenue for different numbers of $0.25 increases in price.
Part A
Based on the data, write a linear function to model the price of one round of golf p(n), in terms of n, the number of $0.25 increases.
Based on the data, write a linear function to model the number of rounds of golf sold in a week, s(n), in terms of n, the number of $0.25 increases.
Part B
Based on the data, write a quadratic function for the weekly revenue in a week, r(n), in terms of n, the number of $0.25 increases.
Use your quadratic function to determine the weekly revenue in a week when tickets cost $6.25.
Part C
The maximum possible weekly revenue in what percent greater than the weekly revenue with no price increases? Justify your answer graphically or algebraically.